Modern marketing has become highly intrusive. Conscious CEO’s want to keep their users loyal, and that’s where smart profiling comes into play. Optimized display of marketing pop-ups (or modals) is a great example of this strategy.
Marketing technology space is exploding. In 2011, there were only about 150 digital marketing enablement tools. In 2021, there are about 20000. Strictly tool-based competitive strategies are becoming obsolete, because almost everyone has access to the same tools. Ability to build relationships with authentic and non-forced experiences becomes critically important. The way to embody this approach is to treat every interaction with users with extreme caution.
Our client (featured on the left) had a similar realisation. Website modals (or pop-ups) have been one of many marketing tools they’ve been using for a long time. In addition to pop-ups, the company has also been using website chat, e-mail automations, multiple marketing campaigns, newsletters, lead generation forms, and a number of additional techniques. At some point, the management started receiving complaints from their users, who were exposed to a significant number of various marketing tactics and strategies. One of the most often reported elements was the online pop-up.
The popup was essentially a lead generation form designed to capture the e-mail addresses of users who didn’t convert. From July 1st to 30 August 2018, the popup has been shown 3732 times and had conversion rate of 2%. Additional point of complaint for the users was the interface of the popup.
The client hired us to use machine learning to optimize the popup display firing rules, so that we only display it for demographics and behavioural cues that signal high conversion probability, hence reducing the burden of seeing the popup when they’re not ready for conversion.
Using Google Analytics and custom ETL that sent the data to BigQuery, as well as a REST API that server predictions of xgboost model, we were able to reduce the number of popup impressions and increase the popup conversion rate, leaving to a higher number of total conversions and better customer experience.
Entering the business understanding phase
The first stage of any machine learning model is to understand the business challenge that needs to be solved.
First, one needs to understand the problem they’re trying to solve. In our case, we had to do our homework in reviewing how our client’s business actually works, who are the users, and what are their characteristics. The best way to answer this question is to create a list of 3-4 business metrics that need to be improved with your data product. These metrics will depend on the type of problem you’re dealing with and can be really diverse, from purely financial measures to marketing metrics such as click-through rate, or even things like production efficiency. Find a metric you can optimize.
As a second step in this phase, create a rough sketch of business logic of the end solution. Where will you get the data from? How good this dataset will be? Create a high-level strategy of how the data is going to be gathered and prepared for further analysis, what kind of model training regime will be used, and most importantly, how will the model predictions be used in the live, production environment. This stage is typically planned during an all-hands meeting with software developers, product owners, project managers, and data scientists.
Smart pop-up: business concept evolution
Don’t worry if you find yourself struggling to come up with a bulletproof business logic for your data product. You need to cycle through it a few times to make it sound. Here’s a four step evolution of the smart pop-up business logic.
Time-based model
The first idea we had was to predict whether to display the popup to a user based solely on the user’s session length prior to the website departure. This approach performed poorly and was discontinued.
Interval behavioural model
The second approach was to train the model on the behavioral data. The dataset would consist of session activity data (clicks, scrolls, etc.). The model would return a binary pop-up display prediction every 5 seconds and pop-up would act accordingly to the prediction without delay. We’ve observed a progress, but still weren’t satisfied.
Batch behavioural model with flag
In the third approach, we’ve combined two types of models: based on user activity (clicks, scrolls, etc.) and session profile (browser, city, operating system, etc.). We’ve also added the concept of a flag – a model output result attached to every session, proactively denoting whether pop-up should be shown in that session upon the user’s website exit.
Session & behaviour sequential model with flag
In the final iteration, we improved the up-to-dateness of the model. We started gathering data about every second user event. This data was used for more accurate predictions. We would keep the predictions in a flag, just as in the third solution, and display the pop-up according to the latest prediction output, as kept in the flag.
Data preparation: the critical element of any ML model
70% of machine learning projects is about preparing the data. That includes getting data, exploring it, and making it useful for the next stages of data science pipeline. Data processing typically has two sub-steps: cleansing and wrangling. Here’s what we’ve learned in this stage.
Once you set out to perform data preprocessing, start with getting a grasp of what is in the data and identify basic features (key, target variable, potential predictors). In the smart pop-up data science journey, the first obstacle from the data science perspective was the cumbersome manner in which Google Analytics allows users to extract data. Using Stitch, ten tables were created and investigated in terms of available features, missing values, duplicates, and unique key values (key meaning browser session ID). As the full scope of key values was not present in all datasets, joining and potential imputation rules had to be devised carefully.
Once you’ve explored the data, extract relevant features and delete duplicates. In our case, we reduced the tables with event data to relevant columns only. Session data, be it categorical or numeric, was extracted, if it would result in less than 10% of missing values after joining.
Third, remember about joining the input datasets. In our case, having concatenated the targets, all predictors were left-joined to them using the session ID as the key. The left join ensured that we do not miss any unique target occurrence, mismatches in the predictor tables would result in missing values.
Preprocessing stage insights
This stage resulted in a dataframe with the following characteristics:
- dataframe with 5504 records and 28 columns,
- goal6completions: target variable (whether a user converted on the popup or not), very low prevalence – 1.5%,
- 17 user activity features – indicators of whether a given event (click, scroll, etc.) occurred or not,
- 10 session profile features – descriptors of the session profile (browser, dayofweek, hour, etc.).
Prevalence & datasets
One of the biggest problems we had to deal with was that of small pop-up conversion prevalence – 1.5% as well as 10 disjoint user activity data sets that had to be merged.
Lessons learned in exploratory data analysis
As a final step in the preprocessing stage, you need to carefully divide your dataset into training set and test set. In our case, the dataset was split into training and test sets with 80:20 ratio, the test set was put aside for EDA (Exploratory Data Analysis) and model training parts to avoid any data leakage influencing the reported metrics. Exploratory data analysis (EDA) stage comes right after you’re finished with data preprocessing. For starters, you should get an idea of predictive power of each raw variable (fitting of simple models, relationship between target and strata of categoricals). The dayofweek, devicecategory and hour features were passed on, as the ones not requiring any transformations. On the other hand, city, country and browser were identified as requiring some recoding to be useful for the analysis. For these three simple random forests were fit to extract variable importances of levels and gain rough proxies of their predictive power. Judging mainly by the feature importances, there was no evident cutoff which would separate some cities from the other. City names carry some additional information, for example their populations can be extracted. Poland was prevalent in the observations, so this should also be taken into consideration. Finally, two variables were created: city_population and city_voivodeship (state equivalent in Poland, took value “Abroad” if a user came from abroad). The former will be imputed with median, while the latter with “Missing” category.
Other variables in EDA
When it comes to the country variable, Poland has expectedly dominated the lower barplot. However, the variable importance plot indicates some predictive power residing in other countries: in Europe and, noticeably, in South America. The ‘(not set)’ value will be associated with NaN’s, because it clearly is missing data. Hence creating a variable specifying continents was chosen as potentially informative. It is worth noting that the information about a user being from Poland is conveyed in the voivodeship recording.

Dimensionality reduction
As another key lesson in exploratory data analysis, you should apply dimension reduction techniques to high-dimensional features (PCA, t-SNE for continuous, word embedding for inflated categoricals). Categoricals were recoded as decided in the previous part. It turned out that distribution of conversions across voivodeship was the most insightful.
Devise transformation and inputation rules
Knowledge of what is in the data stems from looking on the training set as well. One must remember, that the test set and later data incoming when the model is in production do not have to follow the same rules. The most common problems are levels of the categorical variables which did not occur in the training set. A common approach which was used in this case is to recode these to the same category as missing values in the training set. One-hot encoding was applied to categoricals, because any ordering of non-ordinal variable would be meaningless. This resulted in the final dataset which was passed to model training. Remember to create the imputation rules based on the training set and make them applicable to the test set as well.
Model training
Once we’ve accumulated enough business understanding, cleaned the data and explored it, we move to the model training stage. The model is at the heart of our solution. We’ve realized that reviewing the business need and metrics we were trying to optimize was the secret sauce to building a relevant machine learning model. Secondly, model development once again taught us the benefits of good communication inside the team.
Bear in mind that machine learning models needs to be constantly refreshed, because predictions get less accurate over time. Third, it’s hard to apply one machine learning model, trained for a very particular use-case, to another business challenge. We’ve also learned that the production environment is often the first real test for any machine learning model.
AUC curves (initial model, activity model, test set)
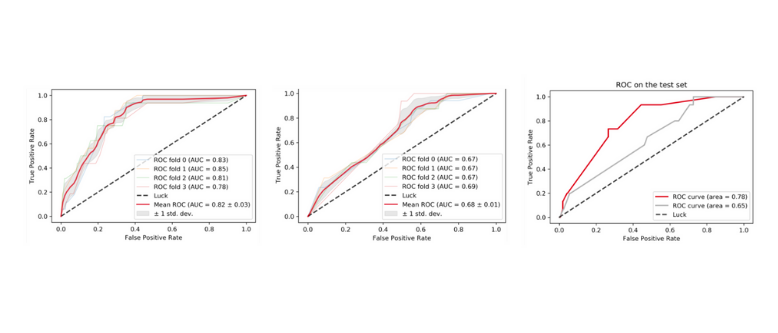
There’re two machine learning models in our application. The first model is trained on the categorical variables describing the session profile. The second model is trained both on the session characteristic as well as behavioural profile of the user, as explained by the events performed by the user during the session. Keep in mind to mindfully choose models to try and parameter grids thereof. In our case, the xgboost implementation of gradient boosting was chosen, as the best off-the-shelf algorithm for low-dimensional classification problems. Following the business logic, two models were trained, one using only the session data, and the other with recorded user activity as well.
Model training: more lessons
When productionizing the ML model, determine which scoring would be the most appropriate from the business perspective, and then run grid searches maximising the chosen metric and select the best models.
As mentioned before, there were two goals of applying ML to popup display problem: to retain all possibly valuable clients and to reduce the negative impact popups have on the uninterested. Primarily, the ratio of people correctly marked as interested to all truly interested should be maximised. This means that sensitivity (recall/TPR) should be maximised while running the grid search. Specificity, on the other hand, would be responsible for the negative impact reduction part which is the secondary goal, as stated before.
A few words about the grid search. Our grid search used 4-fold cross validation and was run on the training set. It is good to perform a sanity check whether the parameters yielding near-maximum metric vary much or not. If so, it suggests that we have reached a stable maximum and can expect similarly good results on the test set.
Choice of probability threshold should be treated as a business decision and adjusted according to the current needs of the particular website.
Productization
Smart Pop-up is a web service providing access to models. Models advice client’s website whether to show a pop-up. Decisions of models are based on data about user and her activity during the session on the website. Therefore, the app exposes a REST API without the need to provide a graphic interface (frontend). There’re 3 main layers of the app.
REST API
As a web framework we chose Tornado. We wanted to use light and scalable framework which exposes business logic through an REST API and provides good integration with Python – Tornado ideally met our needs.
Docker
Business logic of Smart Pop-up is written in Python. There are 3 main reasons for this choice. Python has a comprehensive and large standard library that has automatic memory management and dynamic features. There are numerous machine learning third-par-ty libraries available for Python. Moreover, we wanted the business logic to be explicit and Python as a language which focuses on code readability is a suitable solution.
Database
mongoDB serves as a database in Smart Pop-up. We chose mongoDB as we just need to store a document with basic information for each client and mongoDB ideally serves this purpose. Heart of Smart Pop-up are models, which are not stored in the database.
Application architecture
Models: from training to production usage
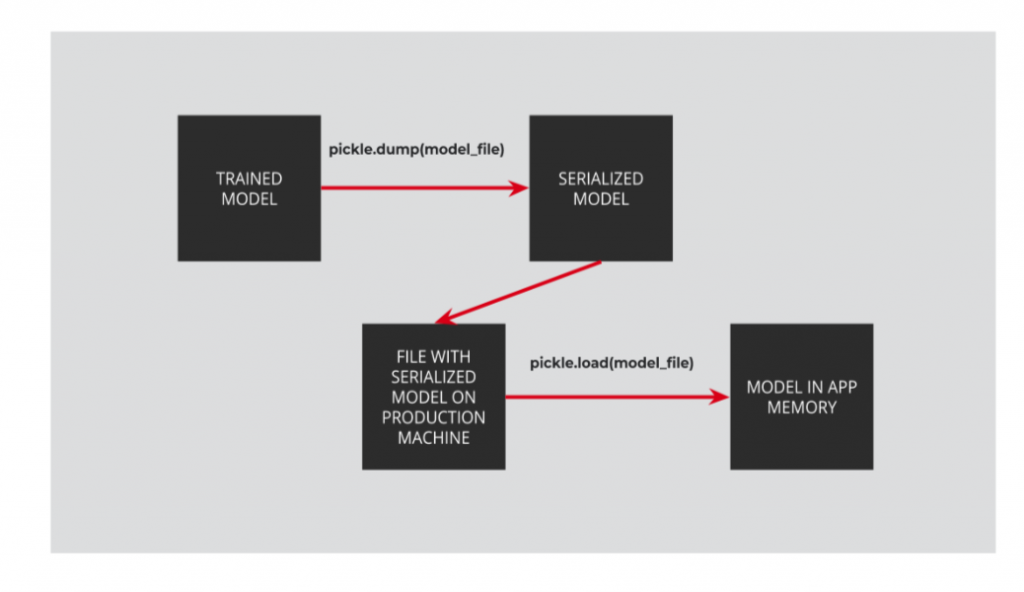
Analytics & data science team and software engineering team work closely when it comes to usage of data models. When data scientists have the model trained, they serialize them. Then, models are copied on the production machine. When the smart pop-up’s process starts, serialized models are deserialized and stored in the application memory.
Containerization
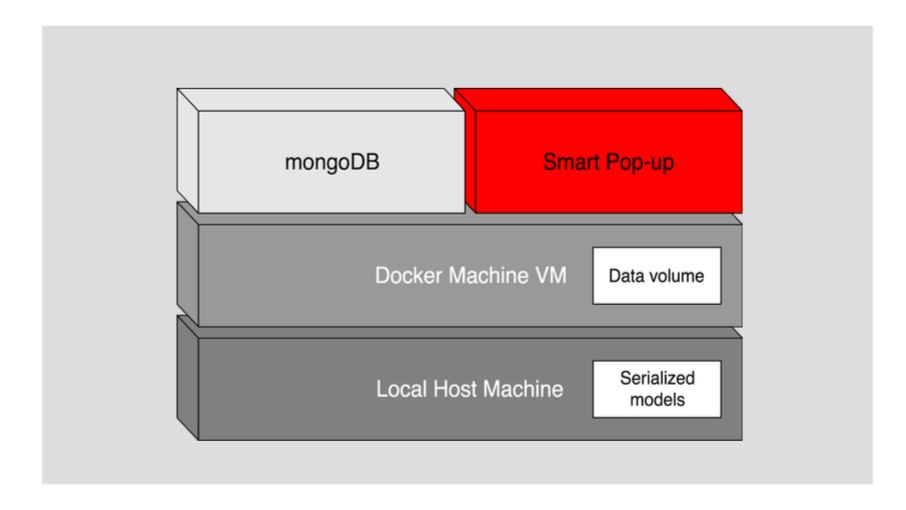
Each web application consists of at least few components. It is a useful practice to group them in containers. Containerization assigns logical responsibility among containers, provides flexibility and makes deployment process easier. Smart Pop-up uses Docker, industry standard containers platform.
Serving pop-up advice
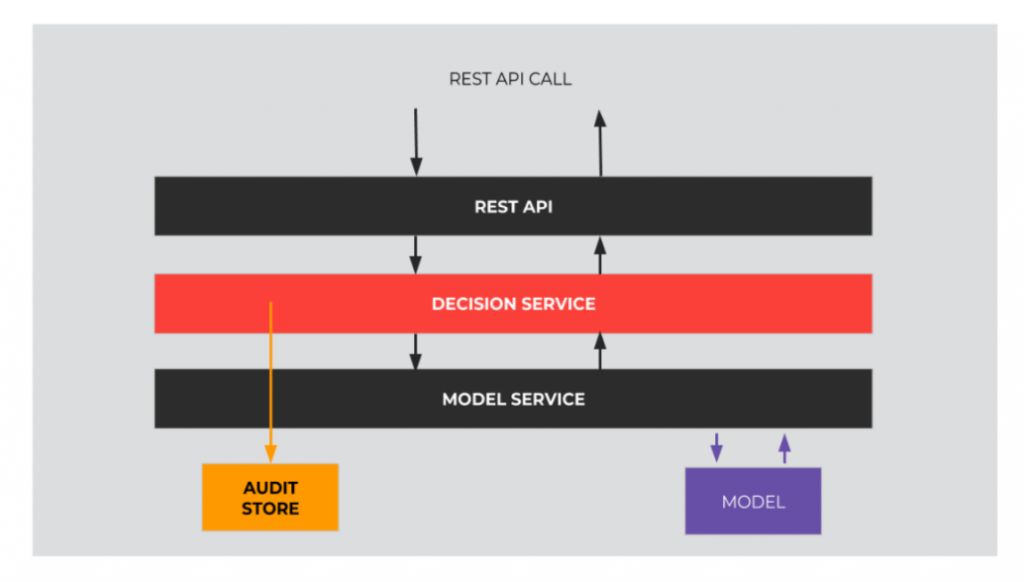
When a request is served, few logical components are involved:
- API layer: authenticates the request and reads the request content
- Decision Service layer: contains business logic of model utilization
- Model Service layer: provides access to models stored in application memory
- Audit Store: stores every decision input and output Obviously, these are not the only components involved, but these are the most important ones from the dataflow point of view. Apart from them, for example a call to the database is required to authenticate the request
Applying machine learning to marketing: checklist
- Explore your data, understand its shortcomings and what information is carried by your predictors.
- Only use features readily available when the model is in production.
- Transform your dataset to wring the most of it.
- Optimize metrics which are relevant from the business POV.
- Critically assess your results, look out for data leakage, report any metrics only on data unseen by the model or EDA.
- Gain and use experience: design a system that solves a business problem and identify biggest risks before implementation.
- Be persistent: hard work in combination with persistence gives amazing results. Make it work, not perfect: focus on providing value instead of writing a perfect code.
- Communicate: team and clients who have knowledge of what your code will be used for.
