Learn the specific steps we've taken to help a fast-growth Series A startup enrich Google Analytics data and understand the complete user journey without spending a fortune on expensive analytics suites.
Starting point
Our client, a software as a service company, approached us with a few measurement and reporting problems. They struggled to understand which marketing activities drove signups of the key user segments (50+ person companies from the retail and hospitality industry), what was the segment CAC, as well as its typical conversion journey. Regular conversion reports in Google Analytics were not enough, and it was really hard to get a valuable insight or signal in all that noise generated by Analytics reports. There was a clear need to add more context to the reports by enriching them with custom data, unique to our client. As a part of our Google Analytics enrichment service, we helped the client solve these issues by implementing custom dimensions, User ID features, upgraded reports, and new custom alerts.
Custom data in Google Analytics
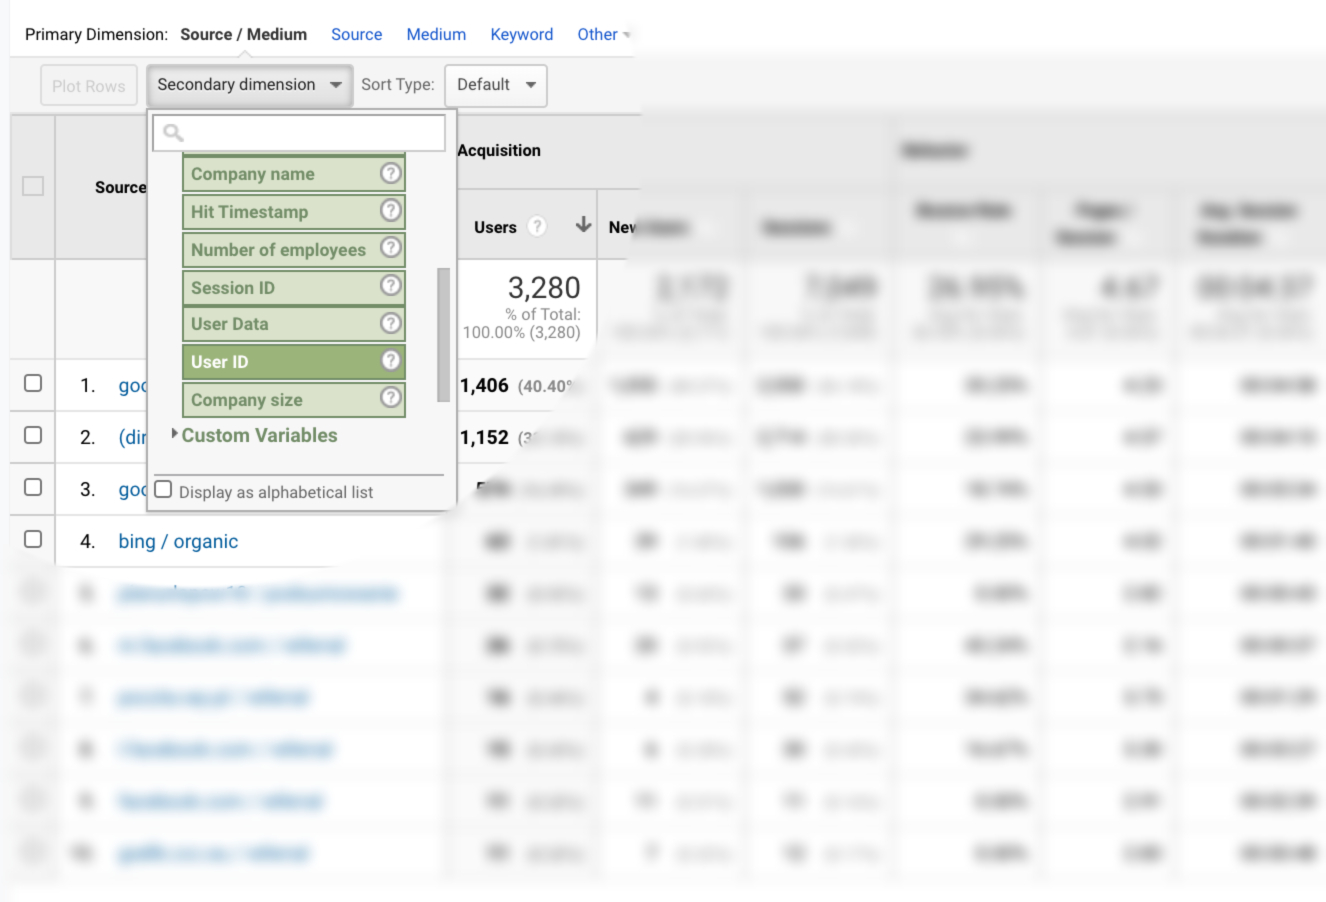
First, we injected more real-life data into Google Analytics using custom dimensions. We created three custom dimensions: company name, company size, and number of employees. Implementing the "user" scope in all dimensions helped us see the entire lifecycle pre- and post-conversion. Whenever a user signed up for the free trial on the website, the custom dimension buckets in Google Analytics were filled up with the information about the company name, size, and industry associated with the signup.
Data stitching
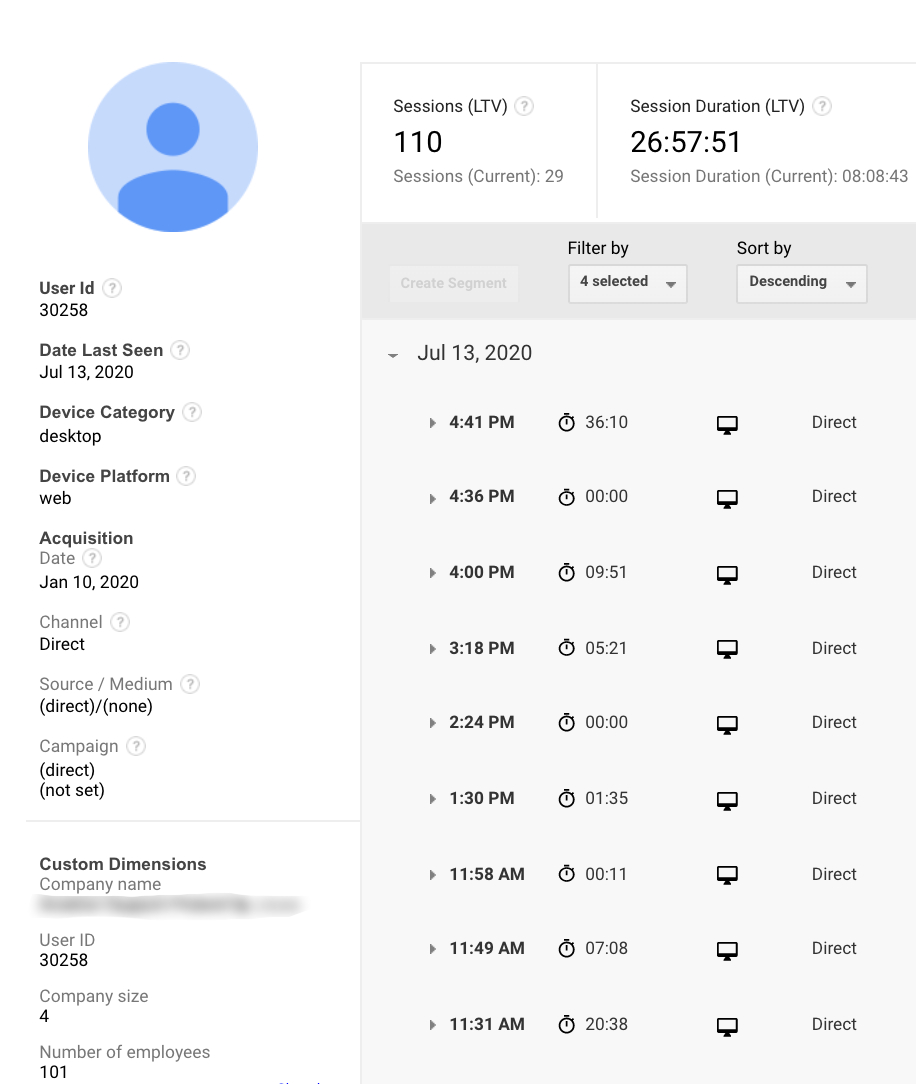
Implementing User ID was the second stage of the enrichment. Our implementation was working in the following way. It grabbed the signup ID (taken from the client's database or CRM at the moment of signup) and passed it to Google Analytics as a User ID. Also, whenever a user logged in to the product, Google Analytics stitched new session data to the User ID data bucket of this particular user, which helped derive full-funnel insights. User ID was implemented using Tag Manager, which saved a lot of developer time. For the User ID to work correctly, we've created another Google Analytics view, which also unlocked enrichment User Explorer reports (as shown here).
Report upgrade
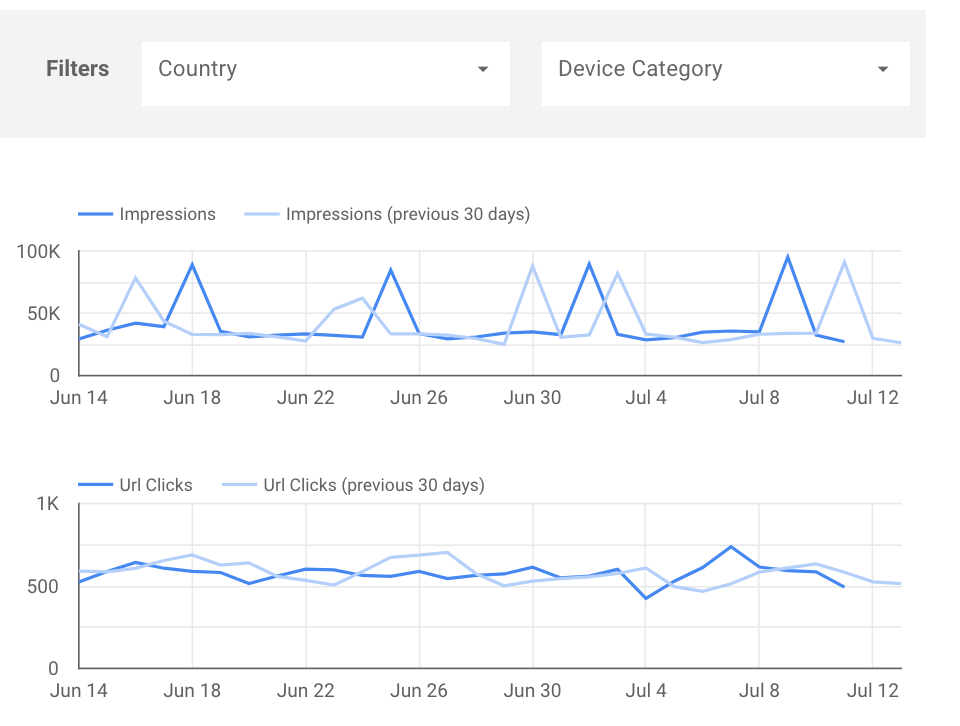
Third, we made sure that the client has an easy way to make the new data easily accessible and actionable. First, we updated the client's Data Studio dashboards and added bar charts as well as histograms to represent the conversion rates associated with particular company sizes (grouped into 4 cohorts) and industries. We have also created a number of advanced segments in Google Analytics, which were later synced with the Google Ads account. Finally, we've added new custom alerts that notified the client of the new campaigns, sources, or keywords that have generated conversions of the key segments.
End result
Enrichment of Google Analytics helped the client understand the similarities and the differences between the marketing sources, top campaigns, and top conversion journeys of the key user segments, company sizes, and specific companies. It provided many valuable insights and played a very important role in optimising the growth engine.

Rich insights
Our client used the new dimensions related to the company size, the number of employees and other things as normal secondary dimensions in Google Analytics reports. This helped generate some amazing new insights. New data provided a lot of new insights on the key mechanisms of conversion, churn, and product engagement across segments and industries. For example, it became clear that the organic channel worked best for the smaller companies, but generated very little enterprise signups, with the exception for the retail industry. Segmentation of traffic sources revealed striking differences in the effectiveness of various campaigns, creatives, and tactics. The profitability of different user segments was also revealed very quickly. New insights made it clear for the client that one of the user segments should be dropped altogether from the marketing activities.
Lower CAC
Enriched data helped reduce the cost of customer acquisition (CAC) by employing the Google Ads optimisation. Using our help, the client has made extensive use of the new advanced segments created out of new data (company size, number of employees, company name). These new audiences served as additional Google Ads audiences or exclusion audiences. Besides, new target audiences inspired the client to create ad groups and ad creatives reflecting the needs of these audiences (e.g. some ad creatives were targeted at larger companies).

Stronger strategy
Finally, the client could clearly see how critical various marketing touchpoints were in nudging the user to convert, use the product regularly, and not churn. This wave of new insights inspired the client to improve the strategy, optimise the onboarding flow and increase conversion rate across the key user segments. Thanks to the new reports, the client got more clarity on the length and steps of the user journeys of all key user segments and became able to map activities to results. Custom dimensions and User-ID's helped stitch pre-conversion dimensions and metrics (such as traffic sources, mediums, devices, or keywords) with post-conversion engagement and activities (such as sales activities, product usage, etc).
Enrich your Google Analytics too!
Learn more about the specifics of the Analytics enrichment service at Datomni.

